Difference between revisions of "TiLDA Debugging using JTAG"
Jburgess777 (talk | contribs) (→Prerequisites: Add reference to header part code from schematic, it looks the same as what I used) |
Jburgess777 (talk | contribs) (→OpenOCD configuration file: simplify tilda.cfg, update example for openocd-0.8.0) |
||
| Line 74: | Line 74: | ||
== OpenOCD configuration file == | == OpenOCD configuration file == | ||
| − | OpenOCD requires a set of configuration commands describing both the JTAG adapter and the target CPU/board | + | OpenOCD requires a set of configuration commands describing both the JTAG adapter and the target CPU/board. Copy this into a file called tilda.cfg: |
<nowiki> | <nowiki> | ||
| − | # | + | # Recommended for OpenOCD-0.7 |
| − | + | # script interface/olimex-arm-usb-tiny-h.cfg | |
| − | |||
| − | # | ||
| − | |||
| − | interface | + | # Recommended for OpenOCD-0.8 |
| − | + | script interface/ftdi/olimex-arm-usb-tiny-h.cfg | |
| − | |||
| − | |||
# script for ATMEL sam3, a CORTEX-M3 chip | # script for ATMEL sam3, a CORTEX-M3 chip | ||
| − | + | script target/at91sam3XXX.cfg | |
| − | |||
| − | |||
| − | |||
| − | |||
| − | |||
| − | |||
| − | |||
| − | |||
| − | |||
| − | |||
| − | |||
| − | |||
| − | |||
| − | |||
| − | |||
| − | |||
| − | |||
| − | |||
| − | |||
| − | |||
| − | |||
| − | |||
| − | |||
| − | |||
| − | |||
| − | |||
| − | |||
| − | |||
| − | |||
| − | + | $_TARGETNAME configure -rtos FreeRTOS | |
| − | |||
| − | |||
| − | |||
| − | |||
| − | |||
| − | |||
| − | |||
| − | |||
| − | |||
| − | |||
| − | |||
| − | |||
| − | |||
| − | |||
| − | |||
| − | |||
| − | |||
| − | |||
| − | |||
| − | |||
| − | |||
| − | |||
| − | |||
| − | |||
| − | |||
| − | |||
| − | |||
| − | |||
| − | |||
| − | |||
| − | |||
| − | |||
| − | |||
| − | |||
| − | |||
| − | |||
| − | |||
| − | |||
| − | |||
</nowiki> | </nowiki> | ||
=== Run OpenOCD === | === Run OpenOCD === | ||
| − | + | OpenOCD uses libusb to access the device and may need to run with sudo for it to work. If everything is connected together and the badge is powered on then you should see it detecting the CPU core as shown below: | |
<nowiki> | <nowiki> | ||
$ sudo openocd -f tilda.cfg | $ sudo openocd -f tilda.cfg | ||
| − | Open On-Chip Debugger 0. | + | Open On-Chip Debugger 0.8.0 (2014-09-17-20:52) |
Licensed under GNU GPL v2 | Licensed under GNU GPL v2 | ||
For bug reports, read | For bug reports, read | ||
| Line 175: | Line 102: | ||
adapter_nsrst_delay: 100 | adapter_nsrst_delay: 100 | ||
jtag_ntrst_delay: 100 | jtag_ntrst_delay: 100 | ||
| − | + | cortex_m reset_config sysresetreq | |
| − | |||
Info : clock speed 500 kHz | Info : clock speed 500 kHz | ||
Info : JTAG tap: sam3.cpu tap/device found: 0x4ba00477 (mfg: 0x23b, part: 0xba00, ver: 0x4) | Info : JTAG tap: sam3.cpu tap/device found: 0x4ba00477 (mfg: 0x23b, part: 0xba00, ver: 0x4) | ||
Info : sam3.cpu: hardware has 6 breakpoints, 4 watchpoints | Info : sam3.cpu: hardware has 6 breakpoints, 4 watchpoints | ||
| − | </nowiki> | + | </nowiki> |
| − | |||
| − | |||
| − | |||
| − | |||
| − | |||
| − | |||
== Patch TiLDA firmware for OpenOCD FreeRTOS detection == | == Patch TiLDA firmware for OpenOCD FreeRTOS detection == | ||
Revision as of 20:41, 17 September 2014
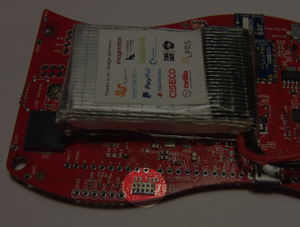
The TiLDA badge has a JTAG port which can be used to perform remote firmware debugging. With the right hardware and software you can use this to run a GDB session on your development machine to insert breakpoints, inspect memory and poke around with the firmware running on the badge just like it was a local process running on your machine.
Prerequisites
I started the list below with the parts that worked for me. Feel free to add alternatives if you know they work for you.
- X86-64 Linux machine for building the firmware and running GDB
- TiLDA badge
- Plus micro USB cable for connecting TiLDA to development machine
- JTAG header, 10 way (2 x 5 pins) 0.05" (or 1.27mm) through hole
- e.g. Samtec FTS-105-01-L-D
- or Harwin M50-3500542 (part number from the TiLDA schematic)
- Fine tipped soldering iron
- Olimex ARM-USB-TINY-H USB JTAG Interface
- Plus USB type A to B cable (the original & large square plug)
- Olimex ARM-JTAG-20-10 20pin to 10pin adapter
- OpenOCD software.
- This can control the Olimex JTAG interface and implements the GDB remote server protocol to talk with the debugger
- GDB
- I used gdb-7.7.1-18.fc20.x86_64.
- Arduino 1.5.7 tools
- For building & installing the firmware image
Attach JTAG Header to badge
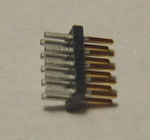
The header must be attached on the correct side of the board otherwise it won't work. The pins on the two sides of the header are slightly different, one side is tin coated and appears silver/grey. These are the ones you should be soldering. The gold plated side should to be used by the connector.
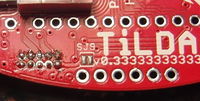
Flip the board upside down and solder pins from the LCD side. The pitch is only 1.27mm (0.05") which is half the size of most normal connectors so you need a steady hand. After you have soldered the pins it is a good idea to test for any short circuits before you power it on.
Olimex adapter and USB-TINY-H
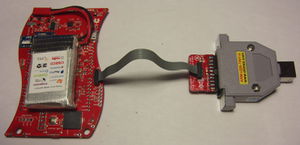
The cable from the Olimex adaper should be connected to the header so that the cable runs away from the board. Once again you may wish to check the connections appear to be the right way around, e.g. pin 1 on the adapter board connects to the 3v3 test point on the TiLDA. Connect the 20 pin side of the adapter into the main USB-TINY, this is keyed so it only fits one way around.
Plug the USB-TINY into a USB port on your machine. The 'dmesg' output should report something like:
usb 2-2: new high-speed USB device number 111 using ehci-pci
usb 2-2: New USB device found, idVendor=15ba, idProduct=002a
usb 2-2: New USB device strings: Mfr=1, Product=2, SerialNumber=3
usb 2-2: Product: Olimex OpenOCD JTAG ARM-USB-TINY-H
usb 2-2: SerialNumber: OLXxxxxx
Install OpenOCD
I started with the current version available in the Fedora package repository (openocd-0.7.0-3.fc20.x86_64). Other Linux distros are likely to have packaged too.
OpenOCD stack pointer bug
After I got everything running I noticed that the GDB backtraces would show the current function (PC) and the caller (LR) but all further stack entries were missing. After some debugging I found that OpenOCD was incorrectly calculating the stack pointer when it tried to align it. I applied a quick fix to disable the broken alignment code:
--- openocd-0.7.0/src/rtos/rtos.c.bak   2014-09-14 17:28:10.000000000 +0100
+++ openocd-0.7.0/src/rtos/rtos.c       2014-09-14 17:29:39.000000000 +0100
@@ -454,12 +454,16 @@
        tmp_str_ptr = *hex_reg_list;
        new_stack_ptr = stack_ptr - stacking->stack_growth_direction *
                stacking->stack_registers_size;
+#if 0
+       // This code gives bad results for already aligned pointers
+       // and negative stack growth
        if (stacking->stack_alignment != 0) {
                /* Align new stack pointer to x byte boundary */
                new_stack_ptr =
                        (new_stack_ptr & (~((int64_t) stacking->stack_alignment - 1))) +
                        ((stacking->stack_growth_direction == -1) ? stacking->stack_alignment : 0);
        }
+#endif
        for (i = 0; i < stacking->num_output_registers; i++) {
                int j;
                for (j = 0; j < stacking->register_offsets[i].width_bits/8; j++) {
I reported the bug to the OpenOCD developers and proper fix will hopefully arrive in the trunk code soon: http://openocd.zylin.com/#/c/2301/ (an initial fix was committed but has since been reverted because it was broken for a different case).
OpenOCD configuration file
OpenOCD requires a set of configuration commands describing both the JTAG adapter and the target CPU/board. Copy this into a file called tilda.cfg:
# Recommended for OpenOCD-0.7
# script interface/olimex-arm-usb-tiny-h.cfg

# Recommended for OpenOCD-0.8
script interface/ftdi/olimex-arm-usb-tiny-h.cfg

# script for ATMEL sam3, a CORTEX-M3 chip
script target/at91sam3XXX.cfg

$_TARGETNAME configure -rtos FreeRTOS
Run OpenOCD
OpenOCD uses libusb to access the device and may need to run with sudo for it to work. If everything is connected together and the badge is powered on then you should see it detecting the CPU core as shown below:
$ sudo openocd -f tilda.cfg
Open On-Chip Debugger 0.8.0 (2014-09-17-20:52)
Licensed under GNU GPL v2
For bug reports, read
        http://openocd.sourceforge.net/doc/doxygen/bugs.html
Info : only one transport option; autoselect 'jtag'
adapter speed: 500 kHz
adapter_nsrst_delay: 100
jtag_ntrst_delay: 100
cortex_m reset_config sysresetreq
Info : clock speed 500 kHz
Info : JTAG tap: sam3.cpu tap/device found: 0x4ba00477 (mfg: 0x23b, part: 0xba00, ver: 0x4)
Info : sam3.cpu: hardware has 6 breakpoints, 4 watchpoints
Patch TiLDA firmware for OpenOCD FreeRTOS detection
The OpenOCD code knows how to find the FreeRTOS tasks and can use this to make each task running on the badge as a different thread in GDB. To make this work you need to apply a small patch to the TiLDA code.
diff --git a/EMF2014/TiLDATask.cpp b/EMF2014/TiLDATask.cpp
index 2cdc08d..701f940 100644
--- a/EMF2014/TiLDATask.cpp
+++ b/EMF2014/TiLDATask.cpp
@@ -58,6 +58,8 @@
 #include "logo.h"
 #include "TiLDA_64x128.h"

+// Hack to make FreeRTOS support work in OpenOCD
+unsigned portBASE_TYPE uxTopUsedPriority;

 TiLDATask::TiLDATask() {

@@ -68,6 +70,10 @@ String TiLDATask::getName() const {
 }

 void TiLDATask::task() {
+
+    // Hack to make FreeRTOS support work in OpenOCD
+    uxTopUsedPriority = configMAX_PRIORITIES - 1;
+
     Tilda::_realTimeClock = new RTC_clock(RC);
     Tilda::_appManager = new AppManager;
This adds a variable that the OpenOCD expects to be able to read from the target to determine how many queues are being used by the FreeRTOS scheduler. This was present in older FreeRTOS release but has since been removed.
Build and flash the badge firmware
To make the debugger work you must be sure that the firmware running on the badge exactly matches the source code and binary objects that you have locally on your development machine. I recommend you apply the patch from the previous section, build the TiLDA firmware and upload it to your badge before you go any further.
In the Arduino IDE you should build firmware (EMF2014 sketch) and upload it via the USB port on the TiLDA badge. (I have not attempted to upload firmware via the JTAG interface but that should be possible as well). The IDE writes a copy of the object files and the final executable to a directory in /tmp whenever you build the code. The firmware image file is EMF2014.cpp.elf and you want to find the most recently built one, e.g.
[jburgess@shark]$ ls -lt /tmp/build*/EMF2014.cpp.elf | head -n 1
-rwxrwxr-x. 1 jburgess jburgess 1475463 Sep 14 22:53 /tmp/build9091009552223609902.tmp/EMF2014.cpp.elf
Running GDB
First locate the EMF2014.cpp.elf file mentioned in the previous section. Run gdb with this file and with any luck it should be able to load it:
[jburgess@shark tmp]$ gdb /tmp/build9091009552223609902.tmp/EMF2014.cpp.elf
GNU gdb (GDB) Fedora 7.7.1-18.fc20
Copyright (C) 2014 Free Software Foundation, Inc.
License GPLv3+: GNU GPL version 3 or later <http://gnu.org/licenses/gpl.html>
This is free software: you are free to change and redistribute it.
There is NO WARRANTY, to the extent permitted by law.  Type "show copying"
and "show warranty" for details.
This GDB was configured as "x86_64-redhat-linux-gnu".
Type "show configuration" for configuration details.
For bug reporting instructions, please see:
<http://www.gnu.org/software/gdb/bugs/>.
Find the GDB manual and other documentation resources online at:
<http://www.gnu.org/software/gdb/documentation/>.
For help, type "help".
Type "apropos word" to search for commands related to "word"...
Reading symbols from /tmp/build9091009552223609902.tmp/EMF2014.cpp.elf...done.
(gdb)
Check debug symbols
Next try some simple commands to see whether GDB knows where symbols are located in the binary and source:
(gdb) info line main
Line 43 of "/home/jburgess/Documents/emf/Mk2-Firmware/hardware/emfcamp/sam/cores/rtos/main.cpp" starts at address 0x8fe78 <main()> and ends at 0x8fe7a <main()+2>.
(gdb) list main
38
39      /*
40       * \brief Main entry point of Arduino application
41       */
42      int main( void )
43      {
44              init();
45
46              initVariant();
47
If something goes wrong at this point you could try using the copy of GDB provided with the arduino tools instead, e.g. arduino-1.5.7/hardware/tools/gcc-arm-none-eabi-4.8.3-2014q1/bin/arm-none-eabi-gdb
Attach GDB to OpenOCD
The OpenOCD supports a couple of different interfaces. Before we try GDB we should first stop the CPU using the basic control interface and tell it to halt the CPU:
$ telnet localhost 4444
Trying 127.0.0.1...
Connected to localhost.
Escape character is '^]'.
Open On-Chip Debugger
> halt
target state: halted
target halted due to debug-request, current mode: Thread
xPSR: 0x61000000 pc: 0x000870ba psp: 0x20074a30
>
To continue execution you can run "resume". Make sure you run "halt" to leave the target in the stopped before attaching GDB. Normally when GDB attaches it should stop the target automatically but this isn't working at the moment. If the target is running then you may when GDB attaches then you may see some odd behaviour.
The OpenOCD software runs a target server on localhost:3333 which we can ask GDB to attach to:
(gdb) target extended-remote localhost:3333
Remote debugging using localhost:3333
0x000870ba in prvCheckTasksWaitingTermination () at /home/jburgess/Documents/emf/Mk2-Firmware/hardware/emfcamp/sam/libraries/FreeRTOS_ARM/utility/tasks.c:2839
2839                    while( uxTasksDeleted > ( UBaseType_t ) 0U )
(gdb)
List FreeRTOS tasks
To list the running tasks you can use "info threads".
(gdb) info threads
[New Thread 537348080]
[New Thread 537396632]
[New Thread 537402416]
[New Thread 537394216]
[New Thread 537405232]
[New Thread 537393096]
[New Thread 537348848]
[New Thread 537398824]
[New Thread 537400224]
[New Thread 537346984]
[New Thread 537403512]
[New Thread 537397728]
[New Thread 537395312]
  Id   Target Id         Frame
  14   Thread 537395312 (MessageCh) 0x00086750 in vPortYield () at emfcamp/sam/libraries/FreeRTOS_ARM/utility/port.c:385
  13   Thread 537397728 (RadioTran) 0x00086750 in vPortYield () at emfcamp/sam/libraries/FreeRTOS_ARM/utility/port.c:385
  12   Thread 537403512 (IMUTask) 0x00086750 in vPortYield () at emfcamp/sam/libraries/FreeRTOS_ARM/utility/port.c:385
  11   Thread 537346984 (TiLDATask) 0x00086750 in vPortYield () at emfcamp/sam/libraries/FreeRTOS_ARM/utility/port.c:385
  10   Thread 537400224 (GUI) 0x00086750 in vPortYield () at emfcamp/sam/libraries/FreeRTOS_ARM/utility/port.c:385
  9    Thread 537398824 (LCD) 0x00086750 in vPortYield () at emfcamp/sam/libraries/FreeRTOS_ARM/utility/port.c:385
  8    Thread 537348848 (Tmr Svc) 0x00086750 in vPortYield () at emfcamp/sam/libraries/FreeRTOS_ARM/utility/port.c:385
  7    Thread 537393096 (RGBTask) 0x00086750 in vPortYield () at emfcamp/sam/libraries/FreeRTOS_ARM/utility/port.c:385
  6    Thread 537405232 (HomeScree) 0x00086750 in vPortYield () at emfcamp/sam/libraries/FreeRTOS_ARM/utility/port.c:385
  5    Thread 537394216 (BatterySa) 0x00086750 in vPortYield () at emfcamp/sam/libraries/FreeRTOS_ARM/utility/port.c:385
  4    Thread 537402416 (PMICTask) 0x00086750 in vPortYield () at emfcamp/sam/libraries/FreeRTOS_ARM/utility/port.c:385
  3    Thread 537396632 (RadioRece) 0x00086750 in vPortYield () at emfcamp/sam/libraries/FreeRTOS_ARM/utility/port.c:385
  2    Thread 537348080 (IDLE :  : Running) 0x000870ba in prvCheckTasksWaitingTermination ()
    at emfcamp/sam/libraries/FreeRTOS_ARM/utility/tasks.c:2839
* 1    Thread 537401320 (AppOpener) 0x000870ba in prvCheckTasksWaitingTermination ()
    at emfcamp/sam/libraries/FreeRTOS_ARM/utility/tasks.c:2839
Most threads should claim to be in "vPortYield()" which is one of the OS routines that a task will call when it wants to sleep for a while.Select a task and you can obtain its backtrace:
(gdb) thread 6
[Switching to thread 6 (Thread 537405232)]
#0  0x00086750 in vPortYield () at emfcamp/sam/libraries/FreeRTOS_ARM/utility/port.c:385
385             __asm volatile( "isb" );
(gdb) bt
#0  0x00086750 in vPortYield () at emfcamp/sam/libraries/FreeRTOS_ARM/utility/port.c:385
#1  0x00085c60 in xEventGroupWaitBits (xEventGroup=0x20082b78, uxBitsToWaitFor=1, xClearOnExit=0, xWaitForAllBits=0, xTicksToWait=<optimized out>)
    at emfcamp/sam/libraries/FreeRTOS_ARM/utility/event_groups.c:357
#2  0x0008453e in HomeScreenApp::task (this=0x20082710) at /tmp/build9091009552223609902.tmp/HomeScreenApp.cpp:157
#3  0x000818b4 in Task::taskCaller (this=0x20082710) at /tmp/build9091009552223609902.tmp/Task.cpp:78
#4  0x00081906 in Task::_task (self=<optimized out>) at /tmp/build9091009552223609902.tmp/Task.cpp:87
#5  0x00086768 in ulPortSetInterruptMask () at emfcamp/sam/libraries/FreeRTOS_ARM/utility/port.c:423
Backtrace stopped: previous frame identical to this frame (corrupt stack?)
Known issues
- Normally when you hit a breakpoint GDB will automatically switch to the thread that hit it. This is not happening at the moment. If you interrupt the code or hit a breakpoint you may have to manually switch threads. The 'info threads' puts "Running" next to task being executed and this is probably the one you need to switch to.
- When you attach and detach GDB doesn't automatically halt/resume the target. You can do this manually using the interface on port 3333 or just tell GDB to continue, then interrupt to stop it.
- On exit GDB hits an assert and asks whether you want a core dump.
- I had a problem where the badge kept stopping at a breakpoint that I set in a previous GDB session and I was unable to fix it without power cycling the badge and restarting GDB & OpenOCD.


